What is a KPI?
Before picking metrics, it's worth getting the definition right. A KPI (Key Performance Indicator) is a quantifiable measure of performance over time, tied to a specific objective.
Financial KPIs are a specific subset of that. They're not about product usage, marketing reach, or team performance. They're the numbers tied to money moving in or out of your business, and they tell you if the business can survive and whether it's worth growing.
Not every KPI is built the same way though. A KPI only works if it has four things in place:
- A measure: something you can actually track. The best ones are expressive, not just counts.
- A target: a specific number that matches your goal and your time horizon.
- A data source: where the number comes from. If this isn't clearly defined, the metric will drift or get updated inconsistently.
- A check-in frequency: daily, weekly, or monthly. If you don't know this, you're probably looking at it too rarely or too often.
Run your current KPIs through this checklist. If any are missing a target or a data source, you don't have a KPI yet. You just have a number you look at sometimes.
Two rules before you build
Rule 1: Pick your goals first, then your metrics.
Most founders do this backwards. They pick metrics they can track, then try to connect them to goals later.
Start the other way around. Identify what your business most needs to achieve in the next 12 months, and then ask: what numbers would tell me if I'm on track? That's your OKR (Objective and Key Result), and the KPIs are what help you track it.
For example: if your objective is to reach €50k Monthly Recurring Revenue (MRR) by Q4, the KPIs supporting it might be monthly revenue growth rate, new customer conversions, and churn. Those three numbers are directly tied to that goal. If they're moving in the right direction, you're on track. If they're not, you know exactly where to look.
A useful guideline is no more than 3 objectives at a time, with no more than 10 KPIs total across all of them. These are best practices, not rules, but go beyond them and you'll find yourself staring at a wall of numbers instead of running a business.
Rule 2: Watch how numbers move, not just where they land.
A revenue total tells you where you are. MoM revenue growth tells you whether you're accelerating or slowing down. The rate of change is almost always the more useful number for decision-making.
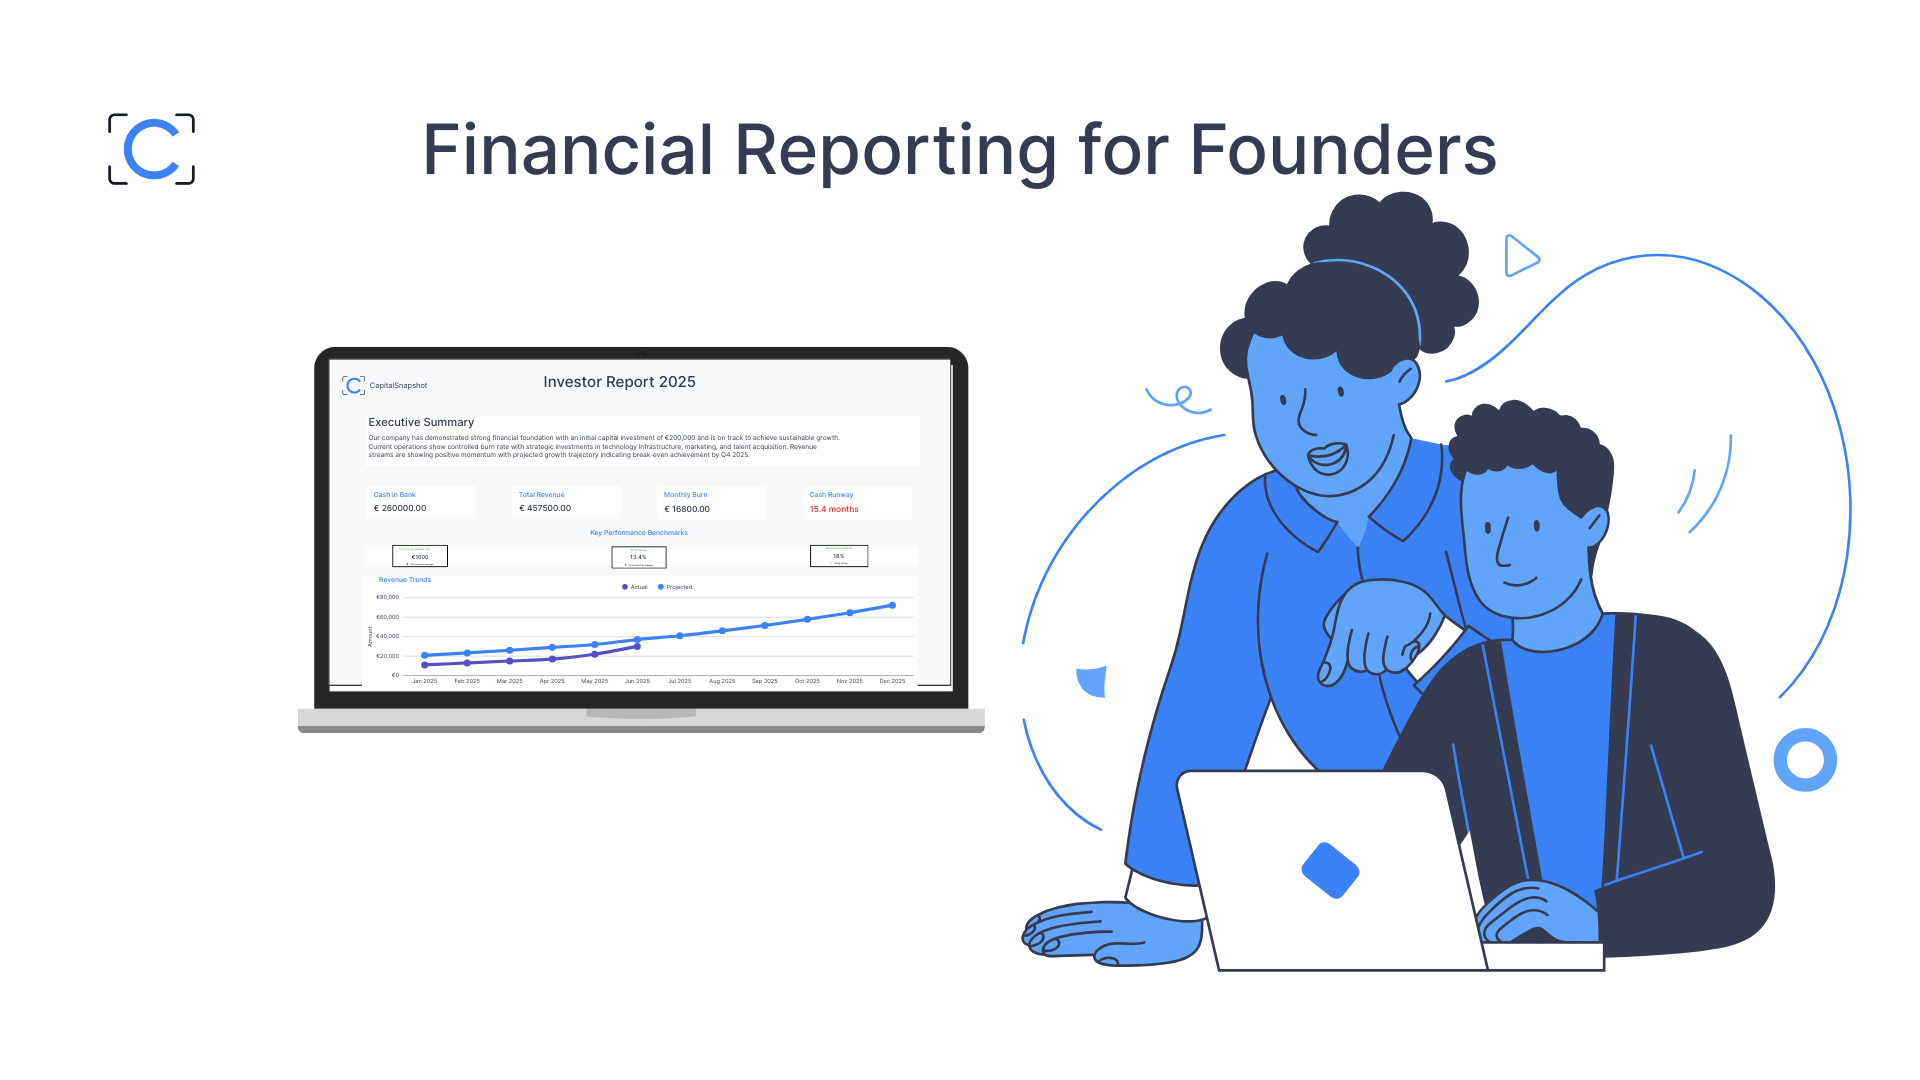
Same goes for cash. Knowing you have €200k in the bank is useful. Knowing your burn has increased 20% over three months tells you something is worth looking at now, not next quarter.
Focus on direction, not just position.
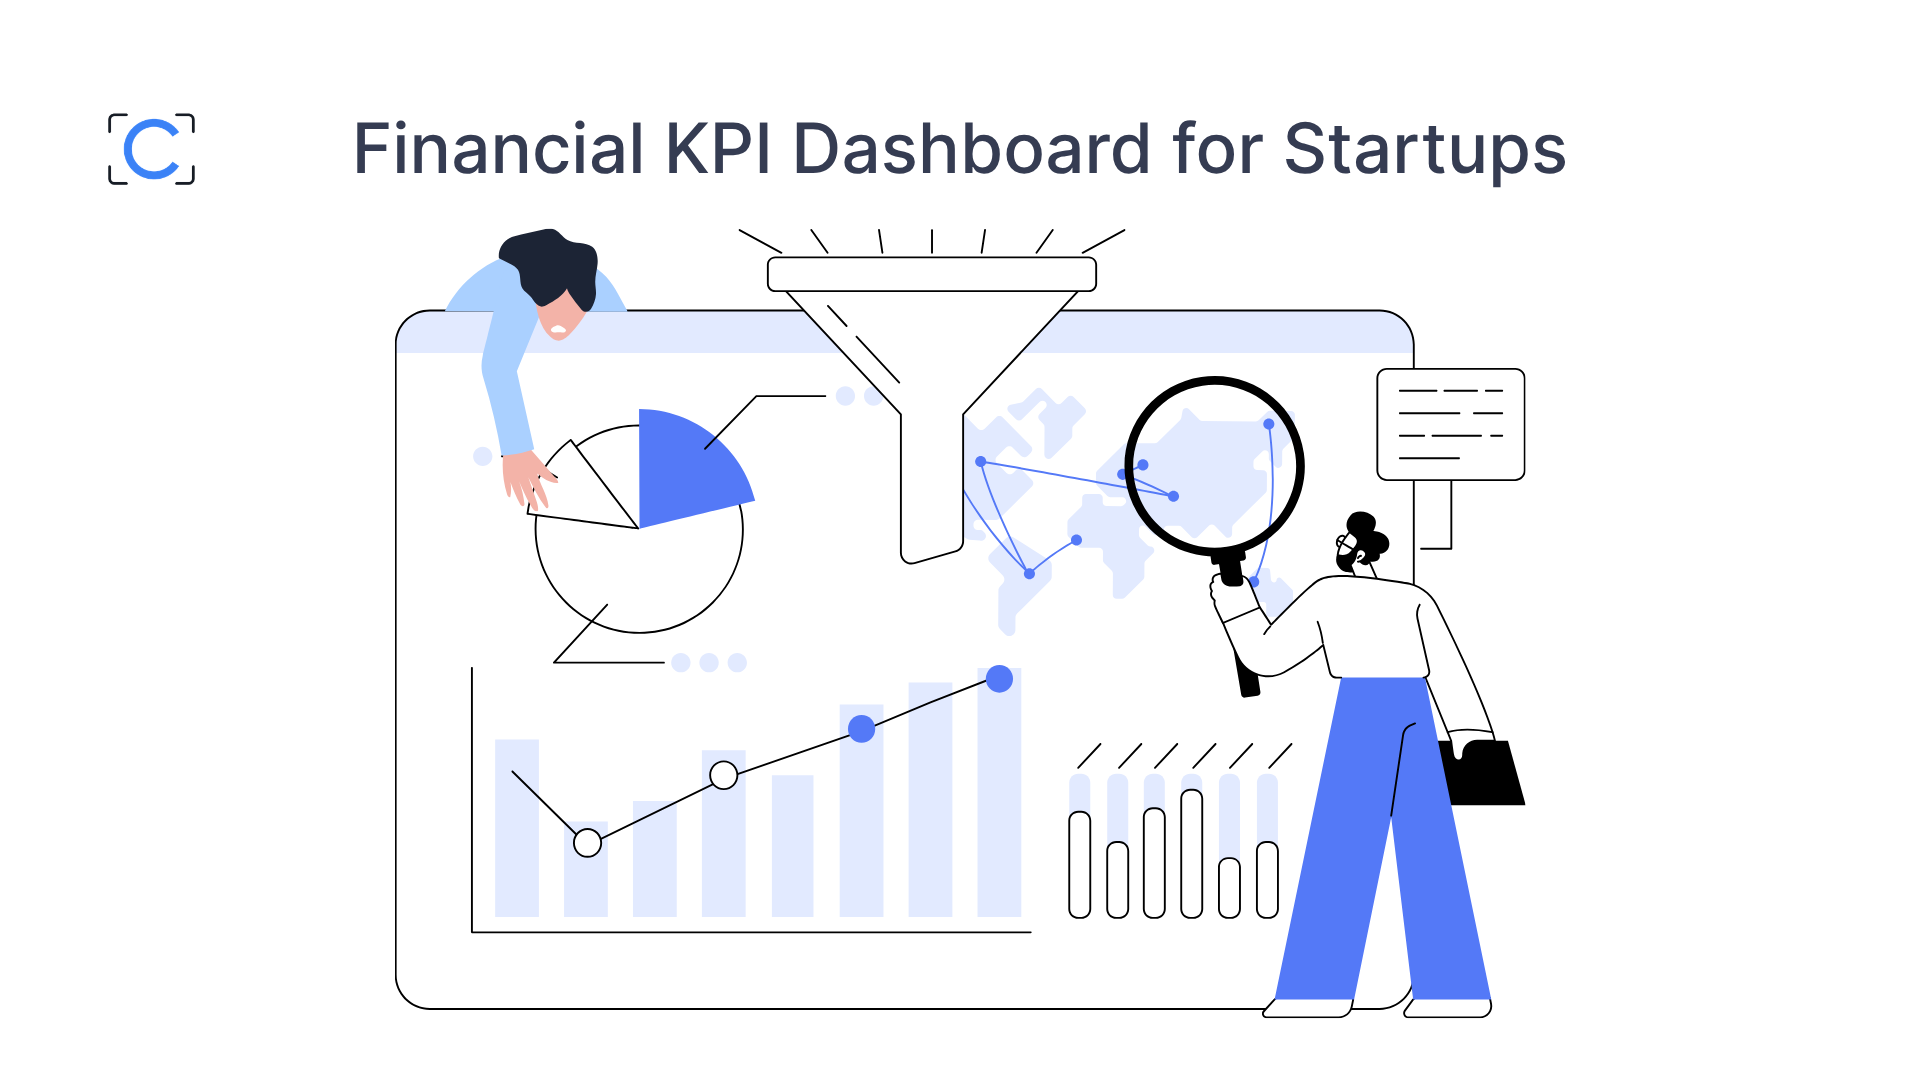
Designing Your dashboard
Your dashboard needs to answer three questions regardless of stage:
- Can we survive the next few months?
- Is our growth efficient?
- Are we deploying capital (spending) wisely?
If a metric doesn't connect to one of those, it probably doesn't belong here.
Whether you're early stage or scaling, the metrics you need differ, and so does how you use them. Financial KPIs fall into two groups.
Survival metrics: These are metrics that every founder needs to track from day one.
Efficiency metrics: These become relevant once revenue is coming in and you need to understand whether growth is actually working.
Survival metrics
1. Cash position
How much money is in the bank right now. The most basic number on your dashboard, and the one that makes every other decision possible or impossible.
2. Burn rate
How fast you're spending. Gross burn is your total monthly outflow. Net burn is what's left after revenue comes in. Track both. If this number is wrong, every decision built on it is risky.
3. Runway
How many months you have left at your current burn. It should reflect actual inflows (revenue, funding, grants) and real outflows (payroll, tools, overhead). It's a moving number, not a fixed one. Most founders check this monthly. You should know this even in your sleep.
Efficiency metrics
4. Revenue growth, MRR or ARR
Monthly Recurring Revenue (MRR) and Annual Recurring Revenue (ARR) track the predictable income coming into the business each month or year. Track the trend, not just the amount. Is it climbing? Plateauing? Spiky? A flat MRR can look fine until you notice it's been flat for four months. The growth rate is what tells you where you're headed.
5. CAC and LTV
Customer Acquisition Cost (CAC) is what you spend to win a new customer. Lifetime Value (LTV) is the total revenue you can expect from them over time. Together they tell you whether your growth engine is efficient. A healthy benchmark is LTV at 3x CAC or above. Below that, you're spending to grow but not earning enough back.
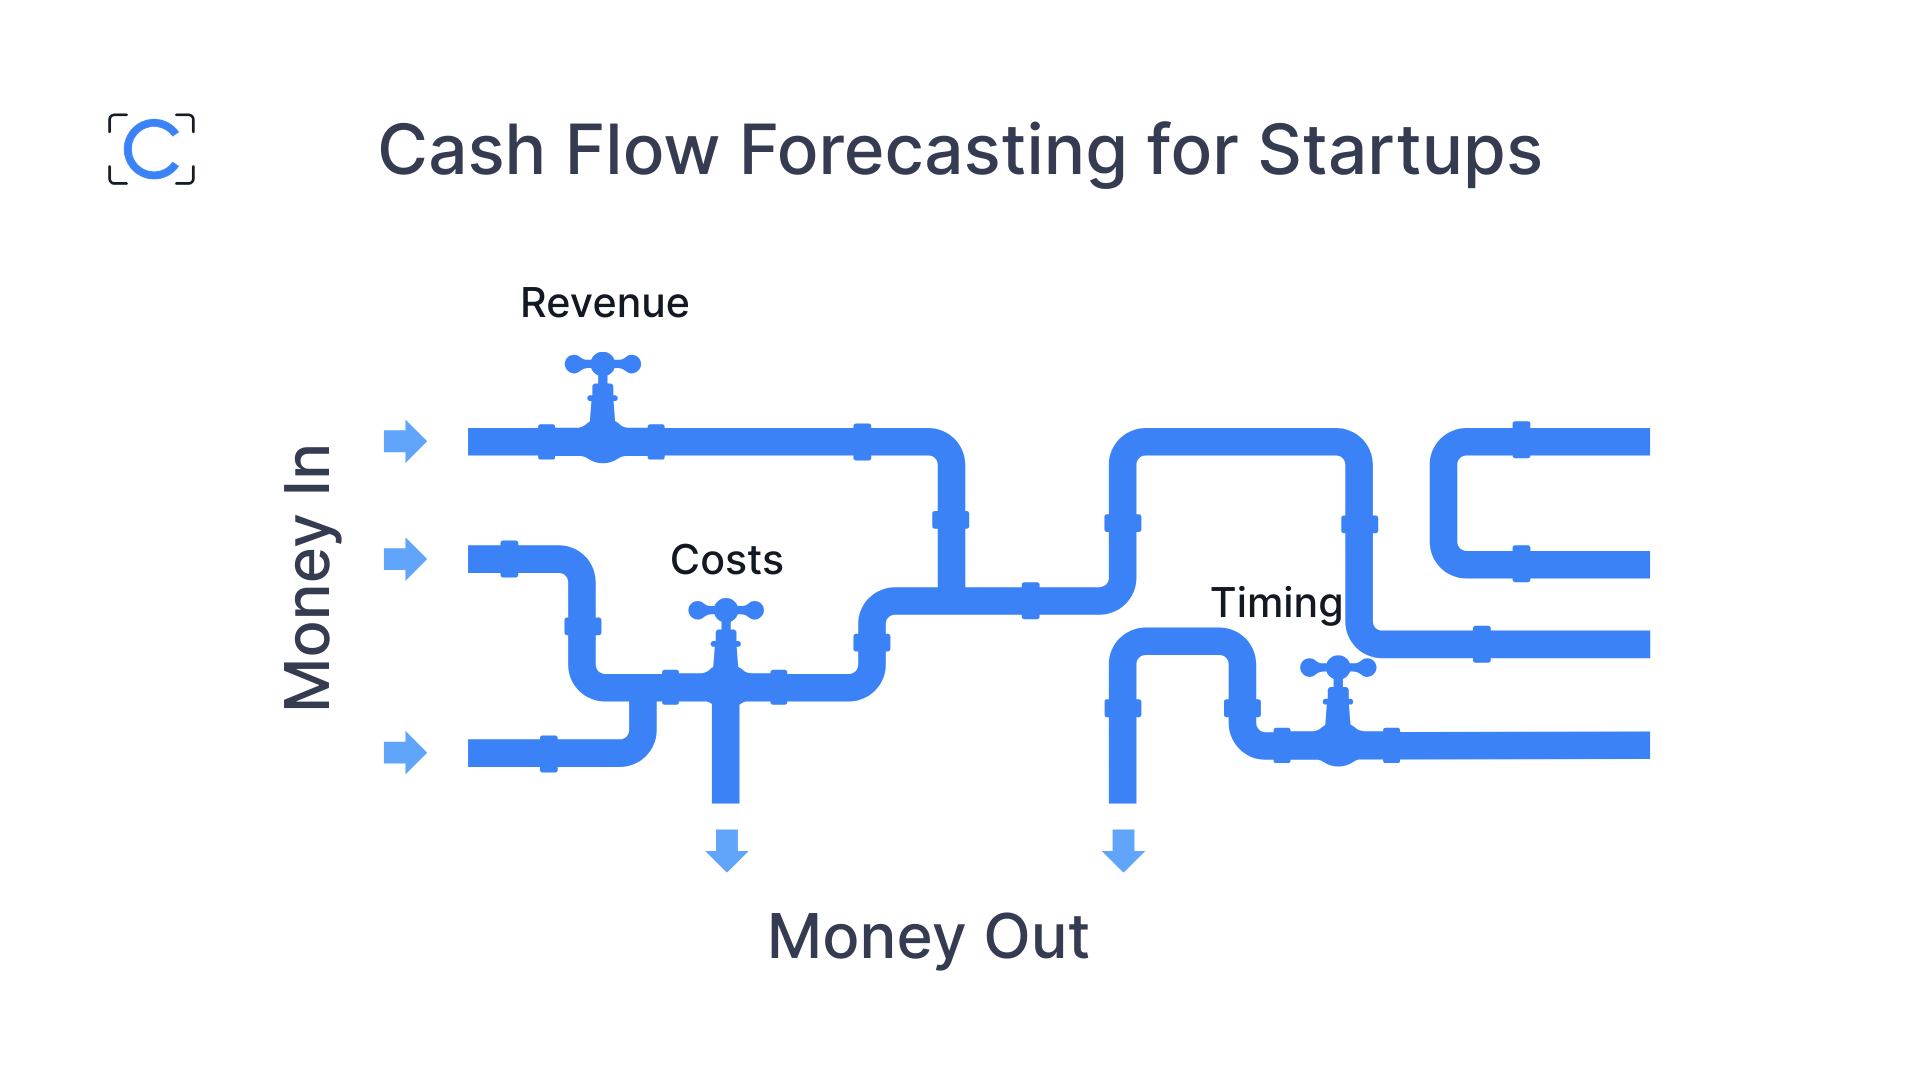
6. Net cash flow
Whether the company generated or burned more cash last month. This is a direct signal of sustainability and a gut-check on whether things are moving in the right direction.
Bonus KPIs for SaaS and subscription businesses:
- Churn rate: how many users cancel or downgrade per month
- Payback period: how long it takes to recover CAC
- Gross margin: how much is left after direct costs
Where Financial Dashboards Go Wrong
The dashboard is only useful if you actually use it to make decisions. Two things tend to break that.
- Tracking numbers without context.
Metrics without interpretation confuse people. Write a short note next to anything that shifted: what changed, why, and what you're doing about it. That's the difference between a chart and a tool. - Updating metrics that don't change decisions.
If you update a number monthly and never act on it, it probably doesn't belong in your dashboard. Every KPI you track should either inform a decision or spark a conversation. Otherwise, it's admin work in disguise.
Putting Your Dashboard to Work
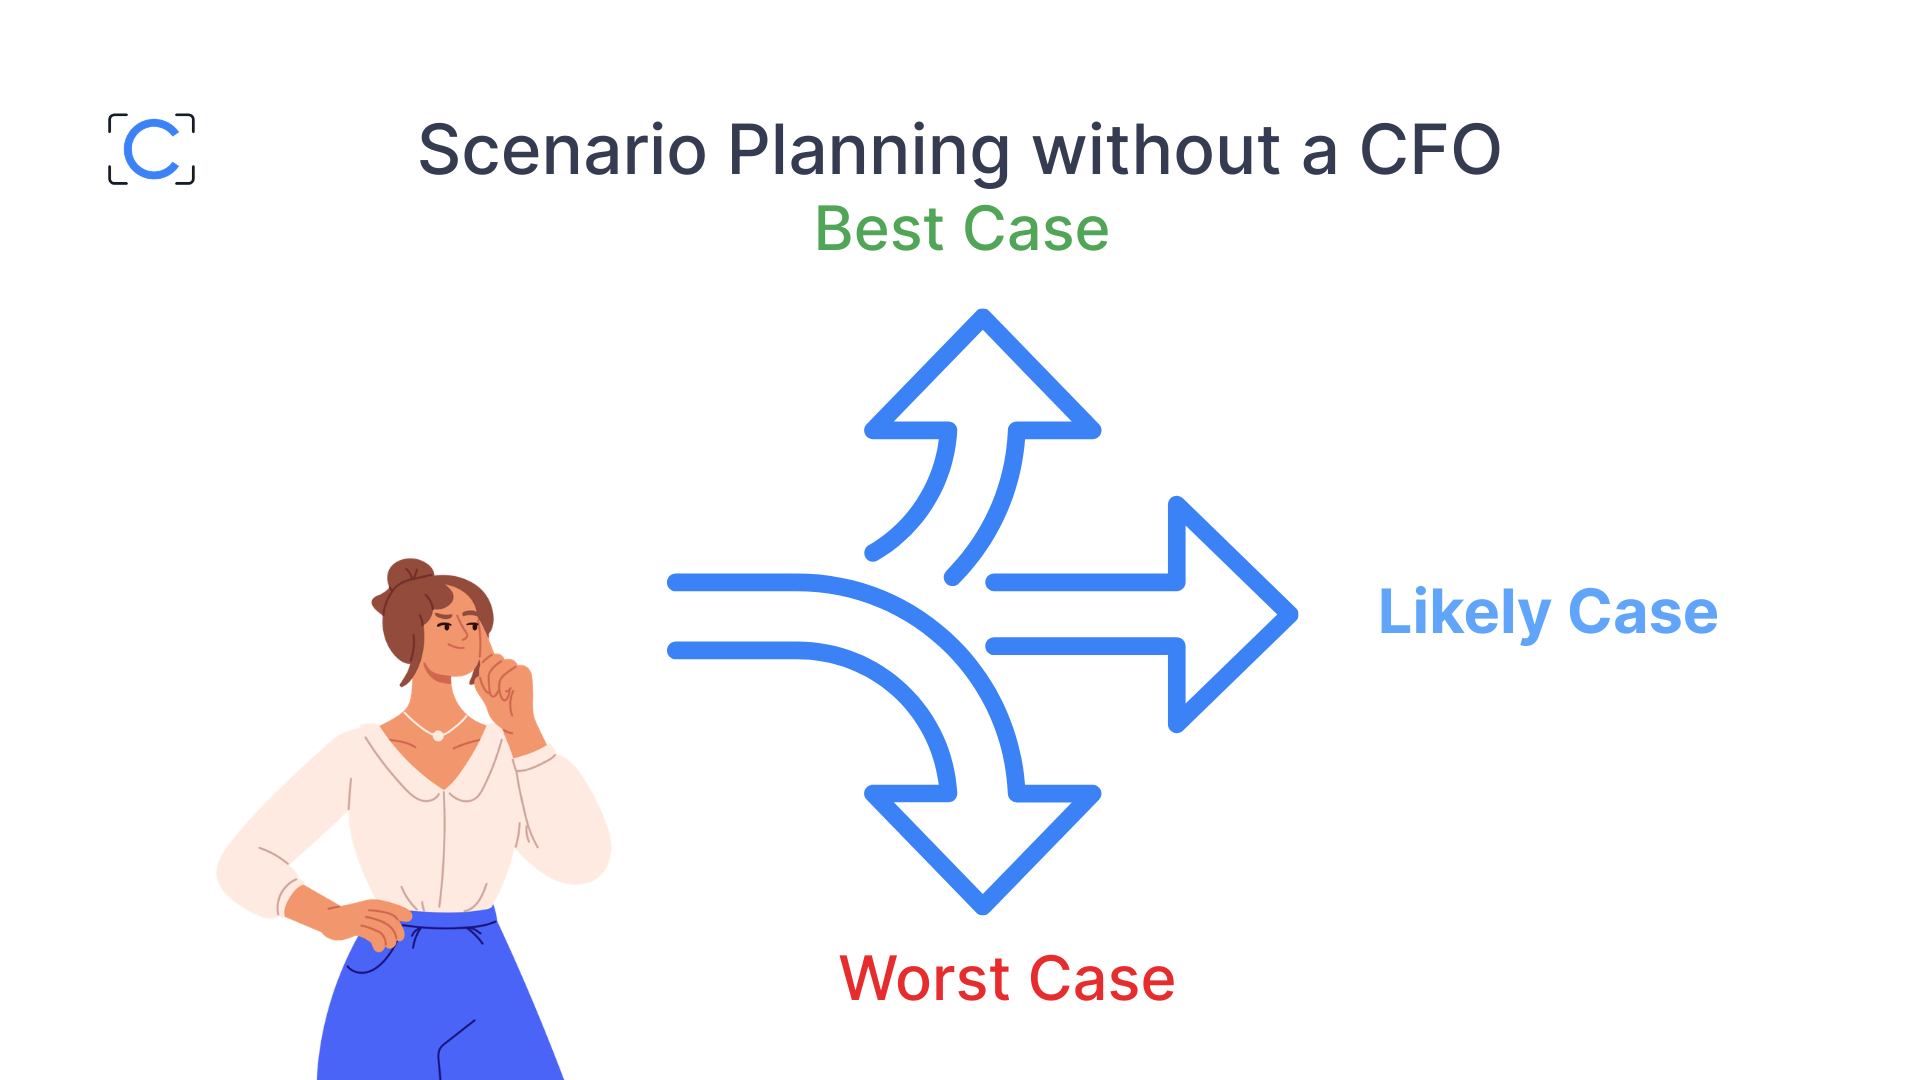
A dashboard is only as useful as the decisions it drives. It tells you whether your bets are working, whether your plan still makes sense, and whether you're heading toward your next milestone or toward a problem you didn't see coming.
You don't need to be a CFO to use it. You just need to track what matters, keep it current, and ask what each number is telling you to do next.
Ready to build your financial KPI dashboard?
Plug in your numbers and get a clear picture of your runway and cash flow in minutes.
→ Build your data room. No finance background needed.